The Simple Steps That Can Prevent Dementia
The Wall Street Journal | My grandmother was terrified of losing her memory, but in...
How Alice Hamilton helped the world see a hidden poison
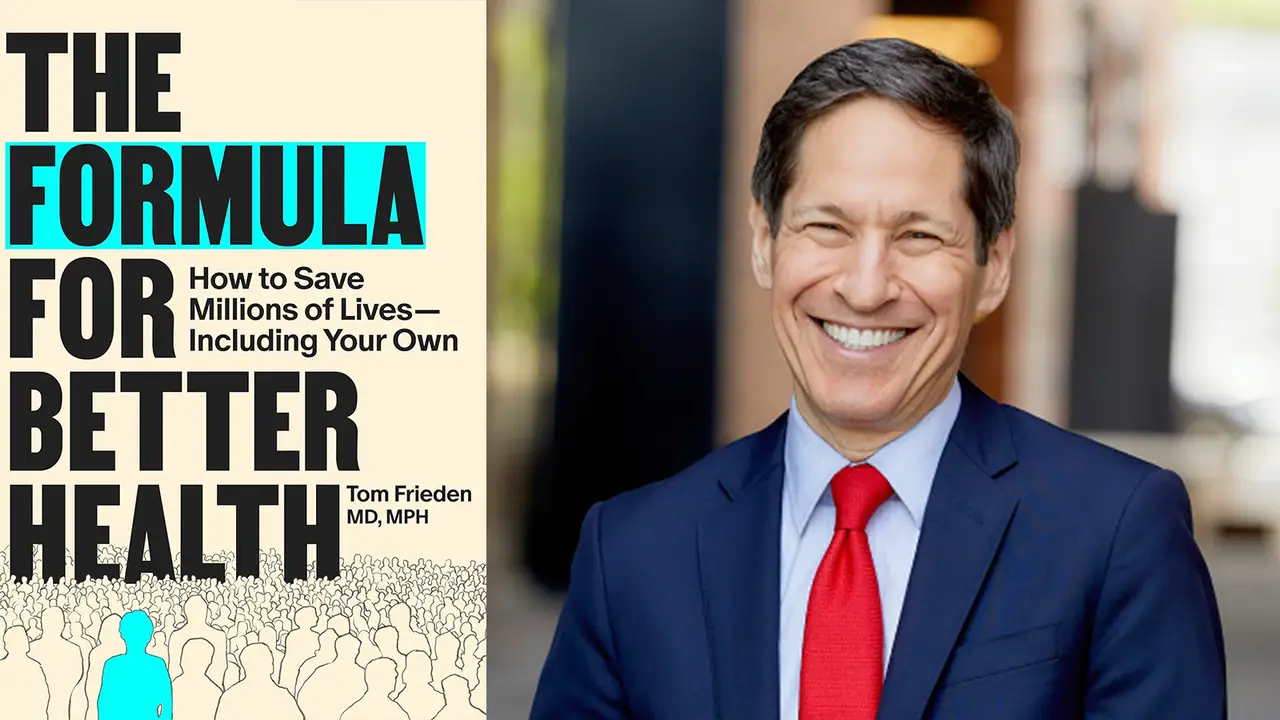
Big Think | In this excerpt from “The Formula for Better Health,” Tom Frieden explores...
The Invisible Diseases Killing Americans
TIME | On Sept. 11, 2001, I was traveling in remote villages in West Bengal,...
The ‘Cassandra’ Curse on Public Health — An excerpt from Tom Frieden’s book, The Formula for Better Health
MedPage Today | The black rotary phone rang in my dingy New York City Health...
A former CDC director’s guide to seeing and stopping threats to America’s health
STAT News | A dangerous idea is on the table: ending universal hepatitis B birth-dose...
Tom Frieden, médecin américain : « Les Etats-Unis torpillent leur propre système de santé et renoncent à leur leadership mondial »
Le Monde | Dans une tribune au « Monde », un ancien directeur des Centres...
Ex-CDC director: The last words my father spoke to me—and what they taught me about saving lives
Fortune | On September 11, 2001, I was deep in rural India, five years into...
We Ran the C.D.C.: Kennedy Is Endangering Every American’s Health
We have each had the honor and privilege of serving as director of the Centers...
Dismantling Public Health Infrastructure, Endangering American Lives
The New England Journal of Medicine | The extreme reductions that the Trump administration is...
Transparency Misinterpreted: CDC Vaccine Policy and Conflicts of Interest
Think Global Health | A former CDC director says the idea that the agency's vaccine...